Last updated on January 25th, 2026 at 06:46 pm
The Super Bowl era can be divided into two separate and almost equal era. The first half was when the run game ruled. Teams played had smash-mouth football. The rules were not as strict as player safety had not factored in as much. This was often referred to as the ground and pound era. These teams were highlighted by such greats as Joe Greene and Lawrence Taylor on defense and running backs like Emmitt Smith and Walter Payton. That era is shown in the following chart on the left where the rush attempts were greater than the pass attempts. This chart plots both attempts per game for the season Super Bowl winner.

Right around the late 1990’s the trend of decreasing rush attempts and increasing pass attempts were crossing. This was highlighted by the 1996 Green Bay Packers Super Bowl team with quarterback Aaron Rodgers and the 1999 St Louis Rams team with quarterback Kurt Warner. You can see their yellow token for pass attempts is suddenly above the green rush attempts token.
The trend lines show the pronounced decrease of the run game and increase of the passing game. Philly really bucked the trend in 2024. But with Barkley and a mobile quarterback not that surprising. That season the league average rush attempts was the all time 11th lowest at 27.
The 1999 Rams with quarterback Kurt Warner and receiver Isaac Bruce pushed the gradual increase of the passing game right about at the cutoff point when both were about equal. The 2005 Pittsburgh Steelers also bucked the trend with two profficient runnning backs of Jerome Bettis and Willie Parker they led the league in rush attempts.
What do the following super bowl winning seasons have in common: 1998 Broncos, 2004 Patriots, 2005 Steelers, 2013 Seahawks, and 2024 Eagles? They all bucked the trend of higher passing in the second half era and had more rush attempts than pass attempts for the season. These teams played old-time smash-mouth football. They had a strong run game pounding out the yards and a strong defense that smothered opponent offenses.
All five teams featured a strong running game, as evidenced by their high rankings in rushing statistics and having a star running back.
| Season | Team | Total Rushing Yards Rank | Rushing Touchdowns Rank | Key Rusher (Yds) |
| 2024 | Eagles | 2nd | 2nd | RB Saquon Barkley (2,005+ yds total) QB Jalen Hurts (150 rushes for 630 yards and 14 td) |
| 2013 | Seahawks | 4th | 13th | RB Marshawn Lynch (1,257 yds) QB Russell Wilson (96 rushes for 539 yards and 1 td) |
| 2005 | Steelers | 5th | 5th | Willie Parker (1,202 yds) |
| 2004 | Patriots | 7th | 9th | Corey Dillon (1,635 yds) |
| 1998 | Broncos | 2nd | 1st | Terrell Davis (2,008 yds) |
This was coupled with a dominant Defense.
| Season | Team | Rushing Yards Rank | Rushing TDs Rank | Total Points | Total Yards | Key Defense |
| 2024 | Eagles | 10th | 2nd | 2nd | 1st | LB Zack Baun (5 Forced Fumbles) |
| 2013 | Seahawks | 8th | 1st | 1st | 1st | CB Richard Sherman (8 Interceptions) |
| 2005 | Steelers | 3rd | 9th | 3rd | 4th | SS Troy Polamalu (78 fumble return yds) LB Joey Porter (10.5 sacks, 2 interceptions) |
| 2004 | Patriots | 6th | 10th | 3rd | 9th | DE Richard Seymour (68 fumble return yds, 1 FR TD) |
| 1998 | Broncos | 3rd | 7th | 9th | 11th | LB Bill Romanowski (7.5 sacks, 2 interceptions, 3 fumbles recovered) |
These Super Bowl winning teams went against the trend of an emphasis on the passing game and won it all with a strong defense and a powerful run game. You can see the reverse order for these teams in the diagram at the top. They were reliving the first era approach.
In the 2025 season there are teams that are following or close to this same approach. The 2025 Seattle Seahawks are a good example. They are now in the Conference Championship game this weekend. Here are the teams that are ranked high defensively. The dark green coded teams also have a good run game. The lighter green teams are close to having a good run game. The team overall defensive rank (Rk) is shown for points and yards and then their rank against the run.
| Rk | Defense | PA | Pts Rk | Yds | Yds Rk | Ply | Y/P | Att | Yds | Rush Yds Rk | TD | Rush TD Rk | Y/A | 1stD | Sum Rk |
| 1 | Denver Broncos | 311 | 3 | 4730 | 2 | 1061 | 4.5 | 400 | 1548 | 2 | 11 | 4 | 3.9 | 85 | 11 |
| 2 | Seattle Seahawks | 292 | 1 | 4860 | 6 | 1065 | 4.6 | 418 | 1563 | 3 | 9 | 2 | 3.7 | 83 | 12 |
| 3 | Houston Texans | 295 | 2 | 4713 | 1 | 985 | 4.8 | 400 | 1593 | 4 | 13 | 9 | 4 | 80 | 16 |
| 4 | New England Patriots | 320 | 4 | 5019 | 8 | 973 | 5.2 | 411 | 1729 | 6 | 11 | 5 | 4.2 | 104 | 23 |
| 5 | Jacksonville Jaguars | 336 | 8 | 5162 | 11 | 1036 | 5 | 369 | 1455 | 1 | 13 | 8 | 3.9 | 85 | 28 |
Here are the teams that are ranked high for having a good run game. Likewise the darker the green coding the better the defense also is.
| Rk | Run Game | Att | Yds | Rush Yds Rk | TD | Rush TD Rk | Y/A | 1stD | Sum RK | |
| 1 | Buffalo Bills | 547 | 2714 | 1 | 30 | 1 | 5 | 146 | 2 | RB James Cook (1621 yds), QB Josh Allen (579 yds) |
| 2 | Baltimore Ravens | 507 | 2662 | 2 | 23 | 3 | 5.3 | 146 | 5 | RB Derrick Henry (1595 yds), QB Lamar Jackson (349 yds) |
| 3 | New York Giants | 511 | 2195 | 5 | 22 | 4 | 4.3 | 141 | 9 | RB Tyrone Tracy Jr. (740 yds), QB Jaxson Dart (487 yds) |
| 4 | New England Patriots | 494 | 2191 | 6 | 22 | 5 | 4.4 | 128 | 11 | RB TreVeyon Henderson (911 yds) |
| 5 | Washington Commanders | 484 | 2290 | 4 | 20 | 8 | 4.7 | 123 | 12 | RB Jacory Croskey-Merritt (805 yds) |
| 6 | Chicago Bears | 505 | 2456 | 3 | 19 | 9 | 4.9 | 142 | 12 | RB D’Andre Swift (1087 yds) |
| 7 | Seattle Seahawks | 507 | 2096 | 10 | 19 | 10 | 4.1 | 125 | 20 | RB Kenneth Walker III (1027 yds) |
| 8 | Dallas Cowboys | 465 | 2136 | 9 | 18 | 11 | 4.6 | 120 | 20 | RB Javonte Williams (1201 yds) |
An interesting development of late is the greater emergence of the mobile quarterback. In the table of top run game teams the top three all have quarterbacks that were the second highest rusher on the team in yards.
The teams in these two latter tables for 2025 can further promote the old smash mouth ground and pound approach by either increasing their run game productivity in the first table or increase their defense ability in the second. Only the Seahawks and the Patriots are there. In the Run Game table the Giants should be even better with the return of injured RB Cam Skattebo and the Commanders with the healthy return of quarterback Jayden Daniels. The Ravens should improve defensively with the hire of ex defensive coordinator Jesse Minter as head coach. THe Bills defense should improve with the return of a healthy Ed Oliver.
The teams listed in the lightest green need significant improvements in the other flip side of run/defense. It will be interesting to see how they are addressed in the off-season.
What do you think? What are some reasons to expect the teams listed to improve either defensively or in the run game in 2026. Add your thoughts in the comments.
Update 1/24:
Denver and Seattle, two teams in the Conference Championship, are the old style “ground and pound” football teams. A query of Super Bowl era teams that had a good run game coupled with a strong defense yielded just six teams. By using league averages as a base, the actual query used was as foolows. For the regular season that
Team offense:
Yds/Rushing Att >= 4.1,
Rushing TD >= 14,
1st Down by Rush >= 105 and
Rushing Yds >= 1900
Team defense:
opp Touchdowns <= 40,
Yards Allowed Per Play <= 5 ,
opp Total Yds <= 5000 and
opp 1st Downs <= 320
The teams that passed this criteria were
| Season | Team | Yds | TD | Y/A | Rsh 1st dwn | Opp Tot Yds | 1stDOpp | DY/P | Opp TD | G | W | L | W-L% |
| 2025 | DEN | 2018 | 18 | 4.4 | 111 | 4730 | 299 | 4.46 | 29 | 17 | 14 | 3 | 0.824 |
| 2025 | SEA | 2096 | 19 | 4.1 | 125 | 4860 | 291 | 4.56 | 31 | 17 | 14 | 3 | 0.824 |
| 2024 | PHI | 3048 | 29 | 4.9 | 164 | 4732 | 293 | 4.74 | 33 | 17 | 14 | 3 | 0.824 |
| 2021 | BUF | 2209 | 20 | 4.8 | 134 | 4637 | 285 | 4.57 | 32 | 17 | 11 | 6 | 0.647 |
| 2020 | LAR | 2018 | 19 | 4.3 | 123 | 4511 | 280 | 4.56 | 33 | 16 | 10 | 6 | 0.625 |
| 2019 | SFO | 2305 | 23 | 4.6 | 110 | 4509 | 285 | 4.66 | 37 | 16 | 13 | 3 | 0.813 |
On defense the query parameters used an average from the 2025 season. So the total query is more geared to recent years. Still it highlights how good these teams were for a ground and pound approach.
This last query used opponent 1st downs. That statistic was not logged by Pro Football Reference prior to 2019. I redid the query using opp 1st Down by Pass <= 180 and opp 1st Down by Rush <= 110. I then removed teams that had a pass attempts breater than rush attempts by 65. Here is a chart of the number of teams by season that made this query

The teams thatare recognized as smash-mouth that made the query are
Dolphins 1970-1977
Steelers 1972-1979
Bears 1976-1988
Cowboys 1992-1993
Jets 2009-2010
Seahawks 2013-2014
Other teams that are not often recognized for this style but made the query are
Chiefs 1966-1969
Cowboys 1968-1979
Raiders 1971-1976
Rams 1971-1977
Patriots 1974-1978
Rams 1985-1986
Broncos 1996-1997
There were numerous other team that fit this approach but in one year durations. The full list can be seen here smash-mouth teams
There were 33 games that had one of the teams fit the profile layed out in the query above, which constitutes smash-mouth ground and pound football. Here is a chart of the teams with the number of such games they had in 2025. All were Wins excpet for three denoted by a red color.

The most pronounced such game was the November 30th game between the Bills and the Steelers. The Bills won 26-7. They had 249 rush yards to 123 passing yards. They won time of possession at 42 to 18 minutes. The Bills held the Steelers third down conversions to 3 of 9.
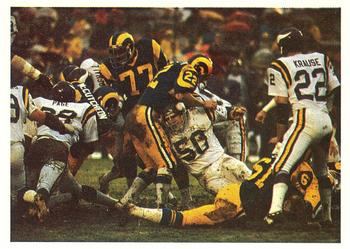
Feature Image: The Vikings’ Purple People Eaters defensive line stopping a Rams rushing play in the 1977 NFC Divisional Playoff game.